
Visual Learning for Science and Engineering
A Visual Learning Campfire - Snowbird, Utah, June 1 – 4, 2002
Principal Authors: Ann Marie Barry, Drew Berry, Steve Cunningham, Julianne Newton, Marla Schweppe, Anne Spalter, Walter Whiteley, Rick Williams, contributions from the entire group
Edited by: Judith R. Brown
The computer is forcing a merging of disciplines
Introduction

Figure 1. A drawing of the view at Snowbird by Ken O'Connell
(click for larger version)
Visual learning is especially important in the areas of engineering and science education, since students must, more than ever, learn to think visually and communicate their ideas visually to both peers and the general public. A Visual Learning Campfire (a highly interdisciplinary workshop-style event in the ACM SIGGRAPH and Eurographics co-sponsored Symposia Program) was held in Snowbird, Utah, June 1 – 4, 2002. This three-day workshop brought together researchers and practitioners from engineering, science, mathematics, psychology, computer science, art, design, photojournalism, and other areas where images play an important role in communicating ideas and enabling education. The twenty-six attendees represented eight countries.
A major goal of the campfire was to develop a white paper on the status of learning and the needs for the future in visual learning in science and engineering, including plans for future college curricula or program development. Since all participants submitted position papers, we started with four groupings, based on the position papers and interests of the attendees:
- story telling and visual images
- thinking and images (became visual cognition and neuroscience)
- design vocabulary (became design process in science and engineering)
- visual learning as a field (became technical visual thinking and communication)
Executive Summary – Visual Learning for Science and Engineering
Visual learning is the use of images and animations to enable and enhance learning at all levels.
Visual learning methods are:
|
Visual learning is especially important in engineering and science because students, more than ever, must learn to think visually and communicate their ideas visually to both peers and the general public. This multi-disciplinary workshop brought together researchers and practitioners from engineering, science, mathematics, psychology, computer science, art, design, photojournalism, and other areas where images play an important role in communicating ideas and enabling education.
Our conclusions are that:
|
We strive to clarify science and engineering concepts, drawing on the successful approaches to problem solving, ways of thinking, and communication skills that have been developed in different disciplines. By integrating three-dimensional visual thinking into existing critical thinking studies across disciplines at all levels, we can create more effective learning environments and accentuate the visual expression and thinking of scientists. By providing course work on creating visualizations within existing science and engineering programs, students will be exposed to the basics of art and design and to a wide variety of visualizations.
Design can contribute to science and engineering education. In order to adapt good design principles and experience to science and engineering, students must learn skills outside their areas of specialty, thus gaining flexibility of perception and thinking and developing visual intuition. By gaining the ability to address problems through different thinking and problem solving skills, students can gain a new understanding of science concepts.
Also, advances in neuroscience within the last decade include better understanding of how the brain processes visual information and events. Knowledge in this area has grown exponentially due to the development of technologies that allow us to observe the brain in action, such as functional MRI. Cognitive neuroscience, particularly in those areas involving the intersection of emotion and higher mental processes, is therefore one of the most significant growth areas of knowledge in visual perception, thinking, and communication. Many assumptions are being shattered, and many surprising insights are being revealed.
One important curricular technique in the process of visual education is to permit students to engage in wide explorations. Stories illustrating core concepts provide a means for students to identify with the topic at hand, and interactive technologies, such as multimedia, virtual reality, and augmented reality, provide new ways of exploring.
Implications in terms of classroom pedagogy include the following:
- Lecture is the least effective way of reaching the whole learning being. To tap into the emotional learning systems, we must engage as many of the senses as possible.
- We must use visuals that suggest and reveal patterns, allowing students to explore, engage in, and complete the meaning of a scientific concept.
- For effective learning, the right brain, and preconscious visual systems, must be integrated with left brain attention through perceptual alerts such as change, color, aesthetics, and story.
 |
|
Figure 2. Right brain/left brain learning model, courtesy of Walter Whiteley (click for larger version) |
| Overall Conclusion and Goal
There is a field of computer graphics-based visual learning, and our specific goal is to set good guidelines for visual learning in science and engineering. Towards this end, we have looked at the components in a one or two semester course, as well as a studio design course for scientists and an interdisciplinary course that begins the task of developing both rational and intuitive intelligences. This field includes the following:
|
Visual cognition and neuroscience
The future of education for visual learning depends on our awareness and utilization of the brain processing that underlies all visual functioning.
The model for brain processing is illustrated by the right brain/left brain learning model shown in the Executive Summary, provided by Walter Whiteley. This is primarily a visual metaphor for critical alternations in modes and levels of thinking which comes from his reflections on learning in geometry and builds on other hierarchical models. The selection of modes of work, visual vs. verbal, or integrated combinations of the two, is described as "meta cognition." This skill at picking your mode and knowing when to switch modes, is identified as a central skill of good problem solvers in mathematics.
We need to develop creators and users of the tools of visual thinking by teaching students to understand and effectively recognize, select, and use the appropriate cognitive modalities for the appropriate tasks. By using visual aspects of various intelligences and learning styles, we can develop exercises that promote the recognition, understanding, effective selection, retention, and use of appropriate cognitive modalities in one or more dimensions, in motion, and in interactive formats. Thus, we will support associative, imaginative, creative, and abstract thinking skills.
There are a number of basic misconceptions about visual perception and communication, as shown below. In contrast, we also provide basic principles that guide design, selection, and use of visuals from a neuroscientific viewpoint.
Basic misconceptions about visual perception and communication
|
| Basic principles that guide design, selection, and use of visuals from a neuroscientific viewpoint
|
 |
|
Figure 3. The cognitive group at work, with the courses group in the background |
Visual cognition and neurobiology
Within the last decade, the understanding of how the brain processes visual information and events has grown exponentially due to the development of technologies that allow us to observe the brain in action, such as functional MRI. Cognitive neuroscience, particularly in those areas involving the intersection of emotion and higher mental processes, is therefore one of the most significant growth areas of knowledge in visual perception, thinking, and communication. Many assumptions are being shattered and many surprising insights are being revealed, as shown in the sets of basic misconceptions and the guiding principles above.
The process of visual perception involves several basic parts, including the sensing of information, the use of past experience, and the processing of information along dual pathways. An understanding of this process is essential to realizing the power of visual images to move us emotionally and behaviorally, and to influence our conscious thought.
First, raw information is gathered from the external world in the form of light falling on and reflecting from surfaces. Both cognitive and emotional systems work in parallel, and both store separate memories of the experience. Next, templates of past experience are compared by executive functions in working memory to what is experienced now. These templates, built and stabilized by neural circuits firing again and again, act as maps for understanding new stimuli and events. In the process, emotional feelings, generated by different subsymbolic systems and involving many brain functions, provide the vast amount of material. Feelings, unconsciously developed and processed, prepare us to cognitively understand what we see.
The idea that visual communication operates cognitively, without the need for reason and before the rational mind is activated is now well documented in the literature of visual cognition, neurobiology, and communication theory. Cognitive neuroscientists and other researchers in many disciplines are providing quantitative data that supports the more intuitive sense about the complexity and significance of visual communication that has been expressed by many artists and scholars. For instance, in 1986, Joseph LeDoux explained the pre-rational nature of visual cognitive processes from a neurobiological perspective. He said “The sensory signals from the eye travel first to the thalamus and then, in a kind of short circuit, to the amygdala before a second signal is sent to the neocortex,” the structure of the brain where rational thought is processed. [LeDoux, 1986, pp. 237-248, 1996]. Antonio Damasio and others have furthered this concept with empirical evidence that suggests that the pre-frontal lobes of the brain are the repository of the unconscious memory that generates “…nonconscious biases (that) guide behavior before conscious knowledge does” and that rational behavior may be dependent upon access to unconscious biases [Bechara & Damasio, 1997, pp. 1293-1295, Damasio, 1999].
The integration of the work of these and other cognitive neuroscientists defines a relationship between the amygdala and pre-frontal lobes suggesting that they work together to mediate and guide pre-conscious behavioral motivations. The amygdala provides the more spontaneous, rudimentary response, and the pre-frontal lobes provide the more sophisticated, synthesistic response, both in pre-conscious formats before the rational, neocortex receives the impulse.
Simply put, visual cognition operates on pre-conscious levels to process visual information into knowledge that motivates behavior before the conscious processes of the neocortex receive the information.
This pre-rational, predominately pre-conscious cognitive ability is called “intuitive intelligence” because intuitive means to attain to knowledge without the use of reason. It is believed that visual intelligence is the primary intuitive intelligence. This does not suggest that visual intelligence is not learned or that visual information cannot be used rationally, but that the initial, primary visual cognitive response is pre-conscious. The subsequent integration of this intuitive, visual cognition with conscious cognitive processes generates expressions of whole-mind cognition that has the potential to foster greater creativity, more powerful cognitive and problem solving abilities, and balance between quality and quantity.
Any science program should begin with a firm grounding in visual theory and practice from an intuitive perspective. Traditional rational approaches to science must be infused with new work in intuitive intelligence and visual learning in order to fully open the window to creativity and visual intelligence. More details on the curriculum that supports this are given in the "curriculum" section below.
There are other, more conscious layers of ‘visual thinking’ as a mode of thought. Aspects include associational logic, the use of transformations to modify one image to another so we can ‘see' other associations, decomposition (visual analysis), and pulling pieces together into a new whole (synthesis). These visual skills can be learned and improved if we put in the time for conscious practice and guided experience.
We noted the principle that we can change what we see through experience. The book, "Drawing on the Right Side of the Brain," by Betty Edwards, makes the point that changing what we see is a central task of learning to draw. However, this possibility applies much more widely, and the ability to see in different ways is a major goal of ‘visual literacy’ and ‘visual education.’ Experts in science 'see' differently than novices. So, we need to create techniques to make these internal processes visible to the novice, and to find ways for students to practice these conscious and unconscious processes.
Story telling also addresses neuro-perceptual issues, contributions from art and design, and social concerns of diversity and communication.
Neuroscientist Gazzaniga (who refers to the location of the core story telling function of the brain as the "interpreter") and Ramachandran (who refers to this location as the "general") posit the existence of a module in the brain that is as old as humanity itself. The purpose of this module, built into the left hemisphere, is to give a unified sense of self to the being. It works by telling stories. The module weaves a story of the self, and it is the most basic function of the cortical part of the brain. It is the most basic way we communicate with one another.
Semiotic background
A basic introduction to semiotic theory and analysis would enable students to ask important questions about visual representations.
Semiotics is a philosophical/analytical theory of meaning and takes two forms: as a field of study in itself, and as a set of methodological approaches for analysis of signifying systems. It has been used within many disciplines. Fundamental to semiotics is the notion of the ’sign’ - being composed of the signifier (the representation of something) and the signified (the thing being represented), classically instantiated by language, where, for instance, the sign "red" is composed of the signifier -the word "red"- and the signified - the concept/percept "red." In story telling, we must consider cultural and cognitive differences in determining the signs and signifiers that encode the story.
One of the major criticisms leveled at semiotics is the primacy of written and spoken language as its principal model. Indeed, one of the principal challenges that confronts semiotics today is how to develop a convincing methodology and theoretical apparatus that can account for non-linguistic forms of meaning-making.
Like any form of knowledge, visual form becomes easier and more precise the more you do it: this is why it takes years for artists to develop drawing skills, for film-makers to develop unique filmic "languages," and for designers to refine designs. These principals of visual learning need to be applied in the area of scientific education. There is an assumption that pictures of things somehow give us "direct access" to them: that photographs are "realistic," that conventional narratives in films are like "real life," that certain types of diagrams and charts reflect more directly that which they propose to depict. It is important to understand the relative nature of representations and to understand that visual representations are artifacts embedded within a culture and within certain types of community within that culture.
In the development of a curriculum for teaching visual thinking to students of science and engineering, there could be no doubt as to the value to a basic introduction to semiotic theory and analysis. It would enable students to ask some important questions about visual representations, not only within the disciplinary area that they specialize in, but more broadly across disciplines and about the culture within which they live.
Part of the process of understanding is to find out how one knows things and how one can know things, and in pursuit of this, it is expeditious to be able to ask the right sorts of questions. In order to formulate these questions effectively, it is often useful to be able to step back from your object of enquiry and ask: "Exactly what am I looking at?" "How is it structured?" "How is it represented to me?" "How am I going to represent this?" and so on. Semiotic approaches can aid in this self-reflexivity in the process of interrogation, by causing us to ask questions of ourselves, not only as viewers, users, and consumers of images, but also as creators of them. In doing so, the very complex processes of visualization can be revealed to a viewer, and what so often seems simple can usefully be perceived as a complex structure, susceptible to analysis, and, crucially, susceptible to dialogue using mutually agreed-upon terminologies and methodological approaches. In this manner, semiotics can provide meaningful structural rigor to the understanding of images and their potentials of meaning.
Social and cultural implications
The ubiquity of visual materials may change the way we perceive and understand the world.
There are a number of questions we might ask about the social and cultural effects of the abundance of visuals in our lives. The ubiquity of visual materials may change the way we perceive and understand the world, including the fields of science and engineering.
As we learn to use visual learning effectively in science through all levels of education, we begin to include significant groups that were previously excluded from the practice of science. These visual learners have the characteristics (including characteristics associated with dyslexia and autism) of some of the most creative scientists of the past [West, Grandin]. The students who will engage in science and engineering through the big ideas and the larger context are also included through effective use of 'story telling' and visual forms in response to their questions [Tobias]. Taking advantage of the visual expression and thinking of scientists increases the development of science and engineering, as well as the effective communication within science. It also informs students about the character of practicing science, which is often highly visual.
Those who teach visual communication must go beyond the standard academic world. They must reach out to both working scientists and people in the schools. They can teach short courses on visual communication to working scientists and take feedback from those scientists to improve the teaching or the content of these courses; this feedback will inform the field and lead to better content and presentation of these ideas at all levels. At the same time, they must work with people in the schools to affect the curriculum at the grade school and high school levels, giving students an idea of the power of visual communication and visual problem solving for understanding science.
Techniques for better learning
Implications of neuroscientific finds in terms of classroom pedagogy include the following:
- Lecture is the least effective way of reaching the whole learning being. To tap into the emotional learning systems, we must engage as many of the senses as possible.
- We must use visuals that suggest and reveal patterns, allowing students to explore, engage in, and complete the meaning of a scientific concept.
- For effective learning, the right brain, and preconscious visual systems, must be integrated with left brain attention through perceptual alerts such as change, color, aesthetics, and story.
In accordance with the above implications, the following techniques should be used to enhance learning in science and engineering:
- engaging the attention through mild cognitive dissonance or ambiguity
- simplifying and abstracting to essential components
- eliminating distractions
- presenting materials in appropriate sequence beginning with the “big picture” context
- utilizing those aspects grasped immediately by the emotional system to further cognitive goals, such as color, shapes, angles, and 2-D or 3-D presentation
- remembering the perceptual tendency toward illusion, such as over-estimating height, assuming cause and effect, or assuming integral relationship
- approaching content experientially allowing for individual discovery and exploration
- using physical materials and 3-D objects for experience and experimentation
- taking the time to explore the multiple visual representations and interpretations that occur within a single classroom
- pausing to ‘unpack’ and repack compressed images that are not ‘obvious and transparent’, so students can learn the layering and conventions
- taking advantage of natural creativity in perceptual process by encouraging analogical thinking
- playing with symmetries and other transformations of an object
- beginning with the most basic and universal symbols and shapes and metaphors from direct experience and progressing through cultural to the idiosyncratic
- using illustrations that are abstracted representations of complex materials
- using examples from the history of science that are important sources of visualization in science
- encouraging illustrated note taking, as well as taking notes focusing on the gist, and then filling in the specifics
Visual communication
Story telling enhances science education by drawing on our most ancient means of communicating, and we can adapt lessons from design practice to create design vocabularies for science areas.
We looked at the need for better ways to teach science and engineering to increasingly diverse groups and the use of visual learning to enhance the teaching of science and engineering. Story telling can be an effective method, and we need to determine the new paradigms for story telling using images, as well as how story telling can improve visual learning in science and engineering.
Story telling enhances science education by drawing on our most ancient means of communicating, in terms of both human cognitive processing and narrative structures, and in finding pathways through known and unknown territories of knowledge. Telling stories with images creates highly effective paths for learning, and we are now developing new ways to tell stories interactively, via virtual reality techniques, creating new pathways that invite more diverse groups to participate. Thus, incorporating story telling imagery into curricula facilitates creative, visual, and holistic thinking among a great variety of learners
 |
|
Figure 4. Storyboard that illustrates types of story telling, by Ken O'Connell (click for larger version) |
Curricular innovations use the traditional guidelines for telling stories to develop new immersive story telling.
Story telling has been ubiquitous through time, and although the tradition of story comes from oral culture, new techniques involve more pictures than text. This in turn invites more diverse groups to tell the stories, making for better stories and stimulating creative thinking in all disciplines, including science and engineering. One important curricular technique in the process of visual education is to permit students to engage in wide explorations. As students explore via immersive story development, they extend their understanding of concepts. A story, where "story" is defined as a method for anything we want to communicate or teach, can be very powerful.
Power of the story
|
 |
|
Figure 5. Story telling group |
There are five key elements of a good story: audience, content, motivation, timing, and semiotics. The importance of the audience is that telling a story with no one around is not story telling. You have to be sensitive to the audience because the goal of a story is to give them new knowledge. We can use a story to help move people from one understanding to another understanding without awareness.
Content is crucial because stories must be about something. If it's a scientific concept, the scientist needs to learn how to build a context, how to segue into the topic, how to develop the best sequence to explain or explore the topic, and finally how to bring it together, make the concept exciting, and relate it to the larger context of scientific ideas.
Motivation is achieved when the story teller tells the story so that the audience feels "it's about us." Identifying with story components is the greatest motivation for attending to the story. The great advantage of interactive stories is that, as the actor, you become part of the story, and you help tell the story. Stories can engage many otherwise unmotivated learners.
It is important to have the right timing and tell the story with attention to progression (beginning, middle, and end). The right pacing holds the audience attention. People have different strengths in dealing with the three parts of the story: beginning, middle, and end. Some are very good with the beginning or setting the context or stage for the story. Others are very good at content development. Still others are very good at bringing together the summation or finish of the idea. Because it is rare that anyone is good at all three parts, small groups or teams working together strengthen a project.
A story teller must consider cultural and cognitive differences in determining the semiotics (signs and signifiers) that encode the story, no matter what the content. Immersive worlds have a unique opportunity to offer multi-vocalities, not only in the text of the story but in the symbols of class and culture – in the signifiers of the users. For example, the "women's gaze" is particularly pertinent if we are trying to attract girls and women into science and engineering. (A "women's gaze" refers to a woman's point of view, including the issues of power, subordination through visual media, objectification of the body, and other characteristics that are usually ascribed to the feminine, with a focus on relationship rather than domination.) In this case, it is important to identify ways to connect with young women's understanding of the context in their lives of learning science and engineering subjects.
Immersive story telling
Interactive technologies, including multimedia, virtual reality, and augmented reality, can provide new ways of story telling. The audience can not only consume the story, but can become an active part of the story. Immersive stories can be highly non-linear, which means that the story can evolve depending on the actions of the participants. For a teaching environment this has the additional value that:
- The story can change depending on the knowledge of the learner, focusing on new topics instead of already-known things.
- Learners have several ways to get to the same goal, giving learners with variable skills more possibilities for solving the task.
- Groups can be involved in the story in order to foster teambuilding
Design process for visual learning
Traditional design can contribute to science and engineering education. As part of the design process, students learn to express solutions to problems by creating models of the solution and developing communications that grow from the audience and the message being communicated. We can adapt lessons from design practice to create design vocabularies for science areas.
Successful design depends on a deep understanding of the message and the audience for the message, and the design decisions flow from these understandings. There are ways in which design for science and engineering will differ from some of the more traditional design areas, however, so there are challenges in understanding the needs of science and engineering and in adapting good design principles and experience to these fields.
The following two diagrams represent common approaches to design problems:
 |
(click for larger version) |
Both of these diagrams represent the interplay of different parts of the design process. In the left-hand diagram, a problem is approached by creating a model, developing an image, and evaluating the extent to which the image solves the problem. If it does not do so fully, then the evaluation attempts to find the point at which the solution breaks down, and we return to that point for further work. In the right-hand diagram, an idea, tools, and mental processes are brought to bear on a product, and they interact with each other to develop the product satisfactorily. Advancing the skill levels of all three vertex topics leads to mastery of the design process. In both cases, there is not one single path to a successful design. Rather, the design is a process that leads to a successful conclusion.
Another traditional concept from information design is that of encoding and decoding ideas, as illustrated in the diagram below. In this concept, a sender has an idea to communicate to a receiver. In order to communicate the idea, it is first encoded by the sender as language, image, sound, or another form, and it is then sent to the receiver via some form of media. The receiver must then decode the message to get the idea. A design is successful if the receiver’s decoding can successfully re-create the original idea.
 |
(click for larger version) |
In this model, effective communication involves more than one set of codes that are delivered simultaneously through different media. The media may be a mixture of formal codes, such as language, and informal codes, such as gesture. The multiple lines show that communication often takes place on several levels simultaneously. For example, verbal communication involves words, vocal inflections, body language, and gestures. In reading, the layout affects the reader's understanding, as well as the type size, line length, and font. In all media the code must be social; both the receiver and sender must be using the same system to encode and decode the message or the meaning will be lost.
Three Dimensions
In science and engineering, 3-D thinking predominates, and in the child’s visual development 3-D vision becomes primary around age two [Hoffman]. There is also increasing evidence that 2-D and 3-D thinking are different cognitive process, and the need to develop 3-D abilities is an important task in visual learning for science and engineering.
The question in science and engineering is not when we need to shift to 3-D, but when we would choose to move down to 2-D in the representation. Models of geometry learning, such as the van Hiele model, recognize the importance of passing through stages to learn to do proofs in plane geometry. This suggests that we need to pay attention to ensuring a solid 3-D base of experience for appropriate development of 3-D reasoning. This would include not just flat representations but work with physical models, and 3-D kinesthetic activities. If students arrive at a university classroom without that foundation, then it must be built up at that time, and not assumed.
Learning 2-D representations of 3-D objects requires extra layers of convention and coding, thus requiring extensive experience and learning. This also increases the chances of misunderstanding between teacher and learner, and makes some tasks of synthesis more difficult. There is a risk that experts, or learners, may confuse the representation with the actual structure. In the history of science, there is a 19th century example of expert chemists confusing 2-D representation of carbon with the physical structure of carbon – and resisting the switch to 3-D structure.
Also, in the history of science, and in anecdotal reports from classrooms, the most effective way of working with dimensions involves a high capacity to shift dimensions and reason among dimensions. [See Gooding’s writings on Faraday.] This powerful learned ability should be one goal of visual work within dimensions. Our base experience of visuals in 3-D is wrapped up in our larger experiences with objects, motion, and planning. We can learn significant design principles for visualization in 3-space from the design principles for 3-D objects, such as the work of [Norman].
The effect of stress
The most effective visual learning occurs in an experiential context, utilizes the workings of the emotional system to prepare for proper conscious cognition, and allows for play as the most effective preparation for and method of learning. Mild stress enhances conscious learning, but too much stress, especially for too long a time, prevents it. Stress speaks primarily to the emotional learning system, and there it works primarily in a negative way. Extreme stress, caused by too much different information, unrelated information, or information too rapidly introduced or presented within too short a space of time, adds to a negative emotional reaction and clicks in a fear response. This memory is engraved below the level of awareness and becomes conscious as an attitude toward or feeling about the situation or topic. This emotional memory is engraved by stress and is responsible for aversion attitudes toward the subject matter and, in the extreme, phobias.
On the other hand, having time to reflect, to integrate, and to sleep on new information stabilizes material in memory. Also, testing in the same mode and in the same learning circumstances aids recall through cueing.
Visual vocabularies
The first step in creating effective design in any field is to understand the audience and the message for the design. We believe there are indeed significant challenges in creating effective visual communication design in the sciences and engineering. However, we believe that there are instances of either general design principles or design experience in other fields that can be adapted to science and engineering. In doing this adaptation, there will be many alternatives that can be considered, so we would expect that there could be many alternate ways to create any particular design or set of designs. We must help students understand the number of options available in design and gain skill in the evaluation of different approaches, as we discussed above.
An example of this may be found in thinking of the meaning of color for the sciences. There are many ways to use color effectively: as an identifier (the red line and green line can be seen as different so they may be compared), as an indicator of relative value (synthetic color from a color ramp can be applied to elements such as surfaces to indicate the relative values of a parameter), as an indicator of exact value (again, colors from a color ramp can be used, although the user can usually only get an approximate value), or as a part of a synthetic scene where color is intended to show the actual color in the real analog of the scene. There are issues in having color as an identifier because there are (possibly unintended) secondary meanings of individual colors or of color combinations. There are also issues in having color as an indicator of relative or exact value because of differences in the ways color ramps are perceived by the audience. For example, color ramps that go from red to blue are often perceived as having meanings of heat, but may simply be used because of contrast, and rainbow color ramps can cause confusions in meaning. There are also different cultural meanings of color. So there are important considerations in how we use color for effective communication and in how color is associated in different ways with different vocabularies in various disciplines. Color is also used to attract or shift attention, a critical visual thinking skill. Programs like dynamic geometry problems use color and changes in color to guide students into more expert patterns of attention.
Design is important in the sciences and engineering because it provides the viewer with guidance in selecting information from the often complex set of materials in a problem. Good design helps the viewer find the clues that show specific things or things with a particular relationship in that complex environment.
Two design areas are less well covered by traditional design education: interface design and interaction design. Interface design is being rapidly developed by game designers. There is very good reason to look at these design decisions for games because game developers must create self-teaching interfaces that enable users to learn how to control game components quickly and fluently. Some of this new work is becoming available to the rest of us as the games community shares its work through traditional presentation and publication channels. Interaction design is probably best done by treating the interaction as if it were with a physical object and modeling the interactions we would have with that object. Design disciplines such as industrial and consumer product design have many things to teach us in this area.
Curriculum
Science and engineering students must be exposed to visual concepts of art and design.
Each of the groups produced some recommendations for visual learning curricula in science and engineering. One group defined a studio design course for science and engineering, a second group created a template for content within existing science and engineering programs, and a third group disussed a visual literacy course. The story telling group proposed a book on story telling for computer graphics that is detailed in Appendix B.
Studio design course
One approach to the issue of visual learning in the sciences and engineering is to create a course based on the methods of a studio design course in art and design, but focused on teaching visual communication and problem solving in the sciences. The studio design course is chosen as a model because students need to encounter visual communication and design concepts and examples whenever they meet communication issues. They need to see examples of both successful and unsuccessful design, along with a comparative analysis that says why one works and the other does not, and for the viable design(s) they need to understand why they work and what underlying principles make them succeed.
This studio model for teaching the design concepts underlying visual communication and visual thinking requires a great deal of collaboration between students. Its studio processes, such as team projects and critiques, help build both teamwork and the students’ abilities to evaluate design work. It should include a multifaceted approach to design, demand a variety of skills, and engage varied learning styles. It should be highly multidisciplinary so the students can get the variety of viewpoints needed to understand the design principles. It is important for students to understand the tools for visual design, to develop the skills necessary to effectively use the tools, and to make informed choices about the media and the tools appropriate to any visual communication task. For students in science and engineering, the course should focus on giving a holistic experience of nonlinear thinking rather than on a linear design process, and it should be accompanied by a survey of related principles from the literature.
 |
|
Figure 6. Drew Berry presents work from the studio design group |
A key concept in this education is that students should learn outside their areas of specialty to expand both their skills and their learning styles. For example, some football players learn ballet so they can expand their range of physical skills. Students in all areas, but especially in the sciences and engineering, should expand their visual vocabulary by experiencing different kinds of design and communication, and particularly by experiencing alternative visualization skills. This will lead to flexibility of perception and thinking and to visual intuition development. Revealing the hidden visual traditions of science, as well as thinking outside traditional science patterns, can have another benefit. These may give students the ability to address problems where the main issue is the understanding of a science concept.
As an example of the value of learning to think outside normal channels, in an experiment one group of Harvard medical students studied art history in an intensive way that included a great deal of visual analysis and learning visual cues, while a control group had no such course. Members of the experimental group were much better at listening and observing patient symptoms from visual and verbal clues. There are a number of teaching tools that are, or can be, developed to assist in teaching design issues, such as interactive textbooks, Web-based courseware, and computer-based laboratories and exercises.
Members of the studio design group were Drew Berry, Steve Cunningham, Sybille Hambach, Frank Hanisch, Mary Stieglitz and Steve Wroble.
Curriculum within a science and engineering program
Another group discussed visual learning in science and engineering from three angles:
- A program in an art and design school, similar to medical illustration but in support of science and engineering instead of medicine, where students learn to produce visualizations for science and engineering.
- A program in a computer science or information technology department where students learn to work in developing visualization materials for science and engineering.
- A program within science and engineering departments where science and engineering students learn about visualization and learn some of the basic skills for producing visualizations.
The first two cases were discussed only briefly. However, it was felt that this type of student would need expertise in the production techniques as well as experience in the areas of science or engineering at a rudimentary level.
In the art and design master's program, students would have a background in one of the content areas or would have a background in visual arts. Depending on the particular background, some courses in a degree program or bridge courses would be required to fill in the areas where the student did not have strong exposure. These would be either art and design courses or courses in science and engineering. Additional curriculum would include techniques used in creating visualizations in science and engineering, study of information design, techniques for working with a content provider, methods for testing the effectiveness of a visualization, and some courses in programming.
A master's degree in computer science or information technology would be similar, but would focus on providing programming support to visualization efforts. It's possible that a single degree would be more interesting, a degree that would be interdisciplinary and include courses in the art/design and programming areas. However, it's likely that students will be stronger in one area or the other.
 |
|
Figure 7. The courses group at work |
Courses group members, clockwise from left foreground: Peter Morse, Pavel Slavik, José Teixeira, John McDonald, Andy van Dam, Marla Schweppe. Not shown, Anne Spalter.
The curriculum within science and engineering programs is of particular interest. This option is to provide course work within existing science and engineering programs. This group felt that all science and engineering students should have some exposure to creating visualization and assumed that they will have some experience with visualizations in their other courses, as those visualizations would be used in presenting other content.
While, with this limited exposure, their skill level in this area might not be strong enough for them to excel at creating visualizations, they would at least have the appropriate vocabulary and some ability to converse effectively with support staff (educated in the other two programs perhaps) who would be creating the visualizations. Or they might decide to pursue further study in a program similar to the two described above.
In discussing what the content of a course of this type might be, it was felt that science and engineering students should be exposed to the basics of art and design including:
- elements
- principles
- basic drawing techniques
- hands-on exercises
- the critique process
See Appendix A for a full description of the context and suggested content of a course in technical visual thinking and communication.
Students should also be exposed to a wide variety of visualizations drawn from science and engineering. The course is designed as modules, rather than specifically as a quarter or semester long course, so that it can be adapted to various situations. (See Appendix A) Certain threads go through all the modules and represent ideas that will develop over duration of the course or courses. These threads are:
- Establish basis of traditional 2-D, 3-D, and motion-based art (including story telling) and design concepts and processes.
- Provide examples and motivation from science and technology from a wide diversity of applications.
- Stress the power of images and visual thinking, as well as when not to use them.
- Bring in relevant materials from perception and cognition literature.
- Bring in relevant materials from semiotics.
- Emphasize the role of planning and due diligence-type research.
- Conduct critiques.
- Establish metrics of success.
A visual literacy course
Asignificant challenge that education and culture face today is the challenge to redesign curriculum so that we develop individuals who understand and value the integrated use all of our cognitive abilities toward greater creativity in problem solving and in the development of culture. Toward this end, Rick Williams from the cognitive group has developed and taught a course that he believes begins the task of developing both rational and intuitive intelligences as equal and complementary components of whole mind cognition. Because all cognitive modalities have significant visual components, visual communication provides an ideal medium through which to teach theories of cognitive balance and is central to both the theory and creative exercises in this course design.
This interdisciplinary course integrates theory in art, neurobiology, psychology, education, visual communication, media and society and other disciplines with creative exercises that are designed to apply the theories in an Omniphasic model of balanced cognition. He has taught this course to more than 5,000 students in two major universities over seven years. The results, as indicated by student’s work and self evaluations suggests that learning to overcome our culture’s rational bias in favor of whole mind cognitive function can increase creativity and problem solving abilities in a wide range of activities and disciplines including art, communication, science and technology. Because all facets of education and culture benefit from enhanced creativity and problem solving abilities, this model should be equally applicable to curriculum in multiple disciplines and cultural and work environments.
Appendix C gives a course syllabus, a description of the creative exercises, and examples of student's work from two of the creative exercises. The student’s work is used with permission. The syllabus is based on a 10 week quarter system course.
 |
|
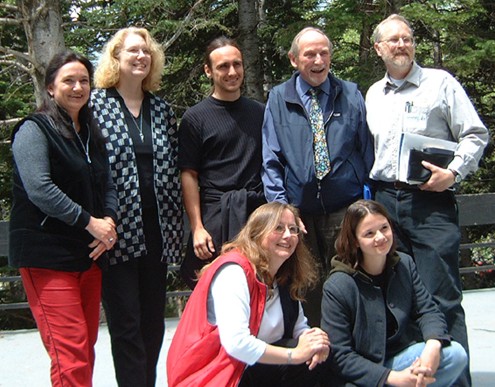
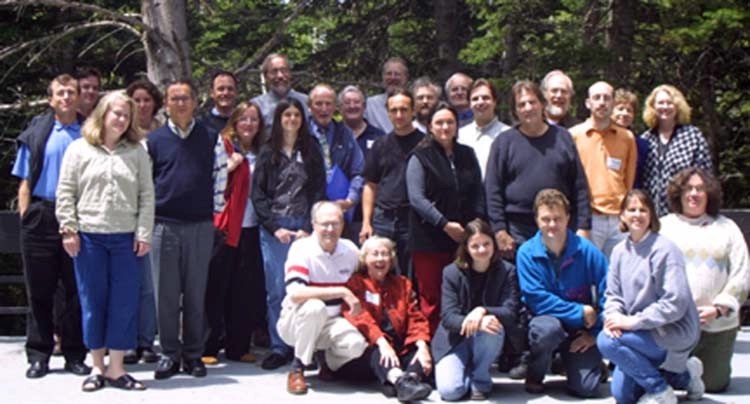
Figure 8. Attendees at the Visual Learning Campfire |
Follow up
It is intended that the discussion from this workshop will continue, and attendees will hold special interest group sessions at other events. The first such gathering was arranged as an Educators Forum at the SIGGRAPH 2002 conference in San Antonio on July 24, 2002. Approximately forty people attended. A general introduction and overview of the executive summary was given by Mike McGrath and Judy Brown, followed by a discussion of the module-based course by Marla Schweppe and Anne Spalter, a discussion of the studio design course by Mary Stieglitz and Steve Cunningham, and a summary from the neuroscience group by Anna Ursyn.
It was not known if there are currently successful collaborations between art and science, although there are some successful collaborations between computer science and art (Electronic Visualization Lab at the University of Illinois at Chicago, Ohio State) and between engineering and art (Purdue University, Virginia Commonwealth University). It was pointed out that engineers do not lack visual skills, but it's a different aesthetic from that of the artist. It was suggested that interactivity and human-computer interaction issues are also important as part of effective communication. Since everyone must process visual information, it is important for everyone to learn how.
Appendix A: Technical Visual Thinking and Communication Course
This is an outline for a lecture and laboratory or studio-style course that will be taught in modules; it is an analog to a technical writing course for science and engineering. The course includes sections on motivation, basic vocabulary, visual language, practical knowledge, and labs and critiques.
MOTIVATIONAL / Overview / Introduction
- Visualization can let people ‘see” an idea sometimes more immediately and completely than symbolic math or text. There is power in images and visualization. A moving image can be worth a thousand still ones, and an interactive moving picture or immersive VR can be worth much more.
- Some visual history and culture, including Lascaux, Egypt, linear perspective, and weather maps. We can learn about formal composition from Russian constructivist work.
- Providing multiple ways or languages for communicating, such as icons with roll-overs of text.
BASIC VOCABULARY
- Cognitive Psychology Vocabulary: What is an image and what are the neuro-perceptual and cognitive processes that underlie our ability to see and understand images? What are the lab counterparts that make this interesting for the students?
- Graphic Design Vocabulary: A basic visual vocabulary for 2D design, including, composition, line, form, color, tonality, texture, negative space, gesture, movement, and balance.
- 3D Design Vocabulary: This includes 2D vocabulary as well as such things as arranging items and lighting (e.g., 3-point lighting).
- Motion Arts Vocabulary: Basic film and animation language and vocabulary, such as cutting, action, composing for motion, 180-degree rule that states you can't go around to the back of a scene because it will look like it’s been reversed, and dissolves. Narrative devices, such as introduction, inciting incident, rising action, and climax, and animation concepts, such as key framing.
- Computer Graphics Vocabulary: Introductory concepts and words, such as raster graphics, vector graphics, 2D coordinate axes, 3D geometry, transformations, and dope sheets for animation.
- Semiotics/Linguistic Theory Vocabulary: Introduction to semiotic terminology and taxonomy, such as signifier, icon, index, symbol, image as metaphor or metonym, or paradigm.
VISUAL LANGUAGE
Theory
- Augmenting visual with audio and haptic. This is not dual coding, but having multiple channels in parallel. Synchronization problems, sonification - even to the extent of visualization for the blind, and disability access to materials.
- When to use what “language”: text, image, etc.
Concepts
- Model vs. image distinction, where "model" can be a mathematical model, a set of rules, or a simulated or acquired data set. Sometimes what lies underneath the visual is more important. The representation can only represent to the degree of its acuity or fidelity, choice of point of view, and other factors.
- Input, processing, and output distinctions. There are many different ways to arrive at the final result.
Techniques
- Informational visualization techniques from both 2D and 3D, including Gant charts, Venn diagrams, and use of fields of scalars, vectors, and tensors.
- Common and differentiating visualizations in the sciences (i.e., used across many sciences), vs. those specific to certain fields.
- Testing research. How has similar data been presented in the past?
- Use of visual statistics to accurately represent the given information, as well as how to inaccurately represent one’s data.
- Appropriateness of the type of representation for use in sciences. Look at both effectiveness and ethics.
- Storyboarding.
- How to measure success.
- Game engines for science teaching and learning purposes.
- The design process.
PRACTICAL
- Image ethics. The need to show flaws in underlying data rather than “smooth” data. We have a choice of what to show or not show.
- Image file formats for storage and transmission.
- File management, such as how to name files, versioning, and file space.
- Output media, to consider whether final images are on CD, DVD, film, video, or another medium.
LABS and CRITIQUES
- Use critiques to provide continuous assessment and feedback. Practice critiquing. Provide language and examples.
- Some drawing to learn how to see better and to make people comfortable with the whole idea of drawing. Easy to learn drawing techniques, as opposed to life drawing.
- Basic traditional 2D and 3D design exercises, such as arranging cutouts, Albers-type color exercises, and perspective.
- Information design techniques, such as Gant charts, mind mapping, and Venn diagrams.
- Photograph a real 3D scene, then create and photographic it virtually.
- Do a visualization by following someone else’s verbal instructions.
- Lighting an orange exercise. Take a sphere and use lighting, texture, and bump maps to create a realistic orange. Fake radiosity with diffuse lighting.
- Exercises in 3D visualization, such as mental rotation exercises.
- Some traditional introduction to art and design exercises for learning composition and color.
- Comic strip making.
- 3D modeling with different techniques, including assembling, “clay” and Boolean techniques, as the software allows.
MODULES (in a rough chronological order)
The course should be taught in a way comfortable for technical students but should introduce them to art vocabulary. The approach needs to be explicit.
- History and Motivation (to set context and “prove” importance of the course content).
-
- Visualization can let people ‘see” an idea sometimes more immediately and completely than symbolic math or text.
- The different fields that contribute to this area: neuro-psychology, semiotics, 2D art and design, 3D design, film theory, communication theory, computer graphics area of computer science. Many vocabularies must be reconciled.
- Some visual history and culture. Lascaux, Egypt, linear perspective, weather maps. Learn about formal composition from Russian constructivist work.
- Successes and failures of visual communication in science and engineering.
- Providing multiple ways and languages for communicating something, such as icons with roll-overs of text.
- What you’ll be able to do after you take the course.
- Visualization can let people ‘see” an idea sometimes more immediately and completely than symbolic math or text.
- Basics of art and design. Defining them, talking about how you use them - composition, flow, color, etc. Show examples that include scientific images, such as 2D representations of 3D data to show that the same design principles apply.
- Drawing techniques. Sketching techniques. Napkin doodling. Rapid communication with sketching and drawing, brainstorming. Focus on both 2D and 3D. Composition exercises, such as windows onto the image and expanding the image.
- Digital photography to practice composing, lighting, and framing shots (for use in 3D later on). Explore orthographic vs. perspective views and relate these to the view volume later on. Visual ethics and communication issues. Panorama and QuickTime VR, stereo vision and images, neurological and cognitive psychology, holography.
- Creating and manipulating digital images. Introduction to image processing, such as filtering, compositing, and color correction. Image file formats and compression options.
- 3D modeling using 3D primitives to do some basic modeling of a single object, stressing planning, research and visualization before getting into the 3D software. Let students use other techniques, such as measuring an object and inputting coordinates. Discuss issues of scale. Think about lighting, framing, and color.
- Advanced 3D, including scenes, concepts of grouping and hierarchy. Different techniques including assembling, sweeps, “clay,” and CSG/Boolean techniques (as the software allows). More advanced primitives, such as NURBs, subdivision surfaces, and solid volumes.
- Film and animation principles, such as cutting, action, composing for motion, 180-degree rule, and dissolves, as well as narrative devices, such as introduction, inciting incident, rising action, and climax. Animation concepts, such as key framing, how the brain processes motion with motion blur. Introduce audio and sound.
- Even More Advanced 3D: Advanced materials, particles, procedural, physically based modeling
- Immersion: virtual reality, augmented reality, head-mounted displays vs. Caves, haptics, sonification, and olfactory.
- 3D Volumes: Voxels, volumetric modeling, and rendering; medical imaging and reconstruction, including the visible human
Appendix B. Book Proposal: Story Telling in Computer Graphics
Rationale: To initiate discourse across the disciplines
- Part I
- Introduce visual learning pioneers through personal narratives of influences in computer graphics, for example people throughout the world who have created shifts in paradigms, technology innovation, creative innovation.
- Explain how stories inform knowledge and enhance learning through interdisciplinary approaches to knowing.
- Ethics of story telling: exploring the blur between fiction and nonfiction, focusing on the social responsibility of the story teller.
- Storytelling around the world, for example how one culture communicates versus how another communicates awareness of cultural differences.
Part II: Ways to Tell Stories
- Mime–Using gesture and movement as story telling.
- Telling stories with comics, for example the emergence of graphic novels.
- Filmmaking with computer science students, using video narratives to exploring with visual language.
- Using the Virtual Flashlight in immersive storytelling.
- Game culture, using interactive games in education, for example, teaching interior design or history.
- Great stories from Engineering and Science: For example telling a story of a collapsing roof to learn the consequences of bad engineering.
- Roots of the Self–using personal stories to increase awareness of personal filters and creative thinking.
- Human Interface with Technology: issues, problems, solutions.
Part III
- Distribution and Channels of Storytelling: From word of mouth to book to screen and disk technologies; forms of publishing, for example, book vs. screen text.
- Future Stories: Visualizing the Impossible.
Appendix C: Visual Literacy Course
Cognitive Balance Through Visual Literacy
© Rick Williams, 2002 (used with permission)
UNO UN UNO ONE UM EIN ICHI
Art and Intelligence: Understanding Intelligence as Intuitive and Rational
| Week One | ||
| 4/1 | Ch. One--The Shaman, The Scientist and The Theologian Omniphasism: Understanding Intelligence as Rational and Intuitive |
p. 1 |
| Creative 1— Accessing Inner Vision—Meditation | p. 12 | |
| Creative 2—Drawings as You Draw Now | p. 26 | |
| 4/3 | Ch. Two--Abu Rocks: Perceptual to Conceptual | p. 19 |
| Understanding Perceptual and Conceptual Cognition Creative 1 & 2, Meditation & First Drawings, Due Today before class. |
||
| Week Two | ||
| 4/8 | Learning to Draw-An OmniphasicExperience Creative 3—Face and Chalice—Drawing On Your Head |
p. 47 |
| Begin Creative 3 in class. | ||
| 4/10 | Ch. Three--Overcoming Intuitive Illiteracy | p. 29 |
| The Rational Bias and Whole Mind Cognition Creative 3, Faces & Drawing on Your Head, Due Today . Creative 4 –Drawing with the Mind’s Eye/Blind Contours |
||
| Begin Creative 4 in class. | p. 67 | |
| Week Three | ||
| 4/15 | Ch. Four--Ulysses in His Right Mind Consciousness and Hemispheric Specialization |
p. 56 |
| 4/17 | Ch. Five--Multiple Intelligences and Unconscious Biases Intelligence, Neural Pathways and Preconscious Mind Creative 4, Drawing with Mind’s Eye, Due Today. |
p. 72 |
|
DUE DU DOS TWO DOIS ZWEI NI Visual Illiteracy and Education: What We Don’t Learn |
||
| Week Four | ||
| 4/22 | Bringing It All Together-An Omniphasic Drawing | |
| Creative 5—Drawing for Real Begin in class.. | p. 91 | |
| 4/24 | Ch. Six --The Square Peg and the Round Hole | p. 93 |
| Education and Intuitive Intelligence Review for Test I Weeks 1-5., Chapters 1-7, Assign. 1-6 Creative 5, Hand Drawings, Due Today before class. Creative 6--Write down a dream & Bring to class. |
||
| Week Five | ||
| 4/29 | Ch. Seven--Insight Out | |
| Dreams, Vision and the Pre-Conscious Mind. | p. 106 | |
| Creative 6—Dream Visions Begin in class. | p. 113 | |
| 5/1 | Test One—Covers weeks 1-5, Chapters 1-7, Assign. 1-6 | |
| Week Six | ||
| 5/6 | Ch. Eight—Vision in Voice | p. 119 |
| Metaphor and the Visual Mind Words as Rational and Intuitive Creative6, Dream Visions, Due Today before class. |
||
| 5/8 | Creative 7—The Visual Word Begin in class. | p. 130 |
|
TRES TOIS TRES THREE TRES DREI SAN The Public as Art and Image The Academy, The Media and Visual Persuasion |
||
| Week Seven | ||
| 5/13 | Ch. Nine--Image Insights Photography: The Omniphasic Medium |
p. 132 |
| Creative 8—Photography/Insight Out Creative7, The Visual Word, Due Today before class |
p. 154 | |
| 5/15 | Ch. Ten--The Sublime Seduction The Academy, the Media and the Corporation Advertising and The End of the World—Sut Jhally Video |
p. 156 |
| Week Eight | ||
| 5/20 | Ch. Eleven-- Designing to Influence Visual Intelligence in Popular Art--Popular Culture Creative 9—Meaning in Visual Communication |
p. 171 |
| Parts I & II—Semiotics and Lester’s Six Perspectives Creative8, Photography, Due today before class |
p. 190 | |
| 5/22 | The Power of Stereotype | |
| Killing Us Softly 3—Jean Kilbourne | Video | |
| Week Nine | ||
| 5/27 | Holiday | |
| 5/29 | Assessing Media From An Intuitive Perspective | |
| Creative 10— Personal Impact Assessment | p. 196 | |
| Test Review—Weeks 6-10. Creative9, Graphic Design, Due Today before class |
||
| Week Ten | ||
| 6/3 | Ch. Twelve--From Ulysses to Artificial Intelligence Toward an Omniphasic Educational Perspective Creative10, PIA, Due Today before class |
p. 207 |
| 6/5 | Test 2—Covers weeks 6-10, Chapters 8-12, Assign. 7-10 | |
Creative Exercises
Assignment 1: Personal Symbolic Portrait. Students draw or create a visual, personal symbolic portrait. Students use everything from collage to pen and ink, colored pencils, crayons, markers and music to represent themselves visually. Slides of each student’s work are shown in class the next meeting day as a symbolic class portrait.
Assignment 2: Pre-instruction Drawing. Students draw a face, a three dimensional object and their hand. These drawings are used to compare to the final drawings in three weeks.
Assignment 3: Chalice/Face and Upside Down Drawing. Students begin to learn to access their intuitive cognitive processes, using these techniques (Nicolaides, 1941, Edwards, 1989).
Assignment 4: Blind Contour Drawing. Students learn to move deeper into their intuitive processes using this technique of drawing without looking at the paper.
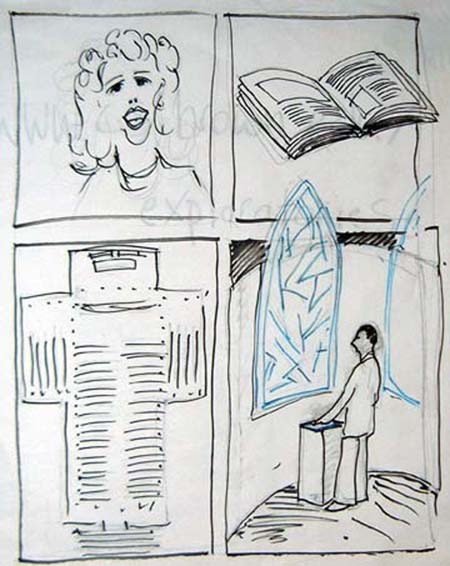
Assignment 5: Final Contour Drawing. This is the students final drawing of their own hand. It is supposed to look like their hand. Slides are made comparing each students pre-instruction and post-instruction drawings of their hand and are shown in class. See Figure 1.
Assignment 6: Dream Interpretation. Students interpret their own dream using Personal Impact Assessment (PIA), an instrument that I developed using a Jung/Johnson technique as the base. (Johnson, 1986). PIA will be used later to assess the intuitive affect of media imagery.
Assignment 7: Word Visions. Students do metaphorical writing inspired by photographs. Writings are read aloud in class on a voluntary basis. See Example 1
Assignment 8: Photography. Students, after basic instruction and preparation, photograph whatever interests them and then use their own images as inspiration for metaphorical writing in class and use PIA on their own images to assess the intuitive, symbolic meaning of their imagery.
Assignment 9 I: Semiotics. Students analyze a media image of their choice from a semiotic perspective to explore the use of design principles and signs to create persuasive associations.
Assignment 9 II: Six Perspectives. Students use Lester’s Six Perspectives to analyze a media image of their choice from personal, historical, technical, ethical, cultural and critical perspectives (Lester, 1994).
Assignment 10: Personal Impact Assessment. Students apply PIA to the same image they used in A-10 in order to assess the intuitive impact of the image from a personal perspective. See Example 2
Example 1
Examples of Student Metaphorical Writing From Images
Creative 7: Word Visions
In this exercise students first spend a few minutes relaxing, perhaps doing an intuitively stimulating exercise such as Blind Contour Drawing (Edwards, 1989). When an image is projected on a large screen at the front of the class, students are asked to look at the image and to begin writing whatever comes to mind, even if it is just a few descriptive words. Typically the words flow into poems or verse as shown below. Students then recite their verses to the class on a voluntary basis. The following poems were written by students viewing my photograph below.
This exercise teaches students to think out of the box and to draw on their intuitive, unconscious mind for creativity and inspiration. It can be applied in any problem solving situation to bring new ideas to mind.
 |
|
(click for larger version) This example was also published in Journal of Visual Literacy, Vol 20, Number 2, Autumn 2000,pp. 219-242, Editor, Nancy Nelson Knupfer, "Beyond Visual Literacy: Part III: Omniphasism in the Classroom through Visual Literacy Toward a New Educational Model." |
Example 2
Creative 10: Personal Impact Assessment Technique
Personal Impact Assessment can be used to determine both the interior/personal meaning(s) of one's own photographs and the personal/interior meaning(s) or impact of others’ images upon the self. The process can be used to better understand media images, as in this case, but can also be used to develop intrapersonal insights about one’s own unconscious motivations and to tap into the extensive synthesistic and creative resources of the unconscious mind. This aspect is particularly useful in breaking set to solve problems in any discipline in new, imaginative ways. There are eight basic steps. The instrument blends rational and intuitive cognitive processes and provides insights that are specific to the individual, since the individual makes all of the choices. It is possible, though not certain, that a class discussion would uncover some of these same meanings; however, such a discussion would not relate the meaning so closely to the personal interior motivations of each individual. I suggest that you review the steps of PIA that follow before reviewing the example of the student PIA that follows.
l. Choose and View the Image: Spend at least two or three minutes just looking at the image and letting your eye and mind wander around the different parts. Notice the light, its direction and contrast and feel. Notice the primary points of interest and where they are placed. Notice lines and curves and basic design elements and how they help or hinder your eye movement. Notice the grain structure. Notice the range of tones and/or colors and how they effect your feelings. Notice how the image makes you feel. Does it draw you in or keep you out? Does it tell a story or stimulate your imagination?
2. List Primary Words: List a single word that describes each of the significant parts of the image--characters, places, things, colors/tone, feelings, etc.—in a column on the left side of a blank sheet of paper. Leave enough space around each word on the list to write other words in Part 3.
3. List Associative Words: Look at each of the descriptive words you have written, one at a time. Start with the first word and, in a circle around that word, write other words (word associations that come into your mind as you think about the first word.) Finish all of the associations for the first word (as many or few as you want) before you move on to the next word.
4. Select Most Significant Associative Word: When you have completed the list of word associations, go back to the first primary word and mull the associative words over in you mind. Again, start with the first descriptive word and its associative words and go down the list. Try to intuit which is the most significant associative word and draw a circle around it. Do not over think this; just say the associative words to yourself until one seems most significant. Do this for each group of associative words you have listed, one at a time. There are no right nor wrong answers. Simply pick the word that seems most appropriate to you as you read the words.
5. List the Most Significant Associate Words: Make a second list of the circled “significant associative” words. Keep then in the same order in which they are found on the associative list.
6. Relate Associative Words to an Inner Part of Yourself: Look at each word in the “significant word association” list and consider what part of your inner self that word represents. Write that part of yourself to the right of the “significant word association”. To determine the inner parts of yourself, it may be helpful to say “my ______ self”. ie: my vulnerable self, my trusting self, my fantasy self.
7. Review the Inner Symbols: Look over these word symbols of your inner self and see if there is some clear connection or story that arises about yourself from the interaction of the inner-symbols from the image. This story or connection or meaning will often come to you in a flash or an ah-haaa response. It will often represent the inner conflicts, emotions, values, or feelings that are behind your personal, intuitive attraction to the image.
8. Write the Story: Write down the story and see how it applies to your attraction to the image or how it offers insight about your own life relative to the image.
If you are using a media generated image like an advertisement, consider how the association of the product with fulfillment of these inner desires and values might establish unconscious biases that would influence your desire for the product and/or influence you to adapt your behavior in some way.
Example 3
Creative 10: Example of Student Personal Impact Assessment of a Media Image
This example was also published in Journal of Visual Literacy, Vol 20, Number 2, Autumn 2000,pp. 219-242, Editor, Nancy Nelson Knupfer, "Beyond Visual Literacy: Part III: Omniphasism in the Classroom through Visual Literacy Toward a New Educational Model."
It includes the image on which this example is based, a very sensual black and white closeup of a young man and woman kissing.
Steps 1, 2, 3 and 4: Viewing, Listing Parts, Word Associations, Significant Association
This example of a student’s Personal Impact assessment of an image (1) at the left is used with permission. The words in bold caps are the parts of the image (2). The lowercase words are the associations (3) and the underlined words represent the significant association.(4)
|
|
|||||||||||||||||||
|
|
|||||||||||||||||||
|
|
|||||||||||||||||||
|
|
|||||||||||||||||||
|
|
|||||||||||||||||||
|
|
|||||||||||||||||||
|
|
|||||||||||||||||||
|
|
Steps 5 and 6: List of Significant Word Association and List of Inner-self Associations
Note that in some casses the student picked two significant associative words for a single primary word. This fine if they seem equally significant.
| Significant Word Association | Inner-self Association |
| Dark | Inner-self |
| Contrast | Fantasy self |
| Dream-like | Fantasy self |
| Fantasy | Make-believe self |
| Beauty | Feminine self |
| Desire | Wanting self |
| Intimate | Vulnerable Self |
| Naked | Vulnerable Self |
| Tender | Maternalistic, loving self |
| Skin | Naked, exposed self |
| Trust | Trusting Self |
| Excitement | Wild, impulsive self |
| Warmth | Loving, content self |
| Smooth | Extreme sensitive self |
| Messy | Impulsive self |
| Flowing | Feminine self |
| Desire | Intimate, sexual self |
| Tongues | Highly sensitive self |
| Animalistic | Sexual, wanting self |
| Closeness | Content, trusting self |
Steps 7 and 8: Assessment and Story
I think this ad drew me in immediately because it had aspects that appealed to me. It looks like a dream or a fantasy and I wanted, for a second, for that fantasy to be me. I envisioned myself in the bed with the handsome man kissing gently, then more passionately. It appealed to my vulnerable, gentle, trusting, loving self and to my impulsive, wild, animal-like, desired self. I felt all of those feelings at once. At the same time the woman radiates beauty, femininity, and sexiness all at once. I would love to look like her just for that one moment in my dream. (emphasis added)
Summary of the PIA Process
In the student’s assessment/story, I underlined all of the words that the student used that are also found in the Significant Associations and Inner-self Associations lists. This comparison makes it clear not only that something lurks below the surface of the obvious sexual attraction implicit in the ad, but what that something is in terms of persuasive seduction for this particular individual.
Most individuals can take a quick look at the image and logically reject the idea that using Jovan Musk will fulfill their sexual needs in this way. Through this rejection a person may feel he/she has understood and countered the effect of the ad. But when they find themselves unwittingly standing at the counter purchasing this or similar products over and over again, they must begin to consider that their rational evaluation and rejection, in fact, did not work and that something else was at play.
In this example, PIA is used to help unmask a sophisticated intuitive messaging system that, on pre-conscious cognitive levels, associates product use with fulfillment of deeply held needs and desires that are both primal and personal in nature. For this student, hose promises of fulfillment include love, tenderness, contentment, beauty, trust, relationship, maternalism, sensitivity and vulnerability on one hand and passion, desire, fantasy, impulsiveness, animalistic nature, sexuality and wildness on the other. These are the “seductions of eloquence” against which Bertrand Russell suggests we need new defenses (Russell, as quoted by Neal Postman, 1989, videocassette).
Note that the student initially only looked at the ad for a “moment in my dream,” which is the way most of us view ads. The eye processes information synthesistically, across space, beyond conscious time. The eye moves and collects information twenty times per second--a process that our rational mind cannot commit to conscious memory, but that our intuitive mind can commit to unconscious memory where unconscious biases formulate strategies for conscious action (Bechara, Damasio et al., 1997). PIA can also be used to develop intrapersonal insights about one’s own unconscious motivations and to tap into the extensive synthesistic and creative resources of the unconscious mind. This aspect is particularly useful in breaking set to solve problems in any discipline in new, imaginative ways.
Appendix D: Bibliography
1. Bibliography
2. Bibliography with Annotated Notes
3. Web-based Publication Bibliography
Bibliography
Andrus J, “Explanation of the Impossible Box and the Plank Illusion”, Skeptical Inquirer, Spring, 1994, pp 316–317
Anno M, Strange Pictures, Tokyo: Fukuikan Shoten, 1968
Anno M, The Unique World of Mitsumasa Anno: Selected Illustrations 1969–1977, Tokyo: Kodansha Ltd, 1977
Anon, Problems of Perceptions of Problems of Perception...: New Perspectives with Stemetil, medical catalogue, England: May and Baker
Barry AMS, Visual intelligence: perception, image, and manipulation in visual
communication, New York: State University of New York Press, 1997
Baldwin H, “Building Better Blivits”, Worm Runners’ Digest, vol 9, 1967, pp 104–106
Balzert H, Lehrbuch der Software-Technik: Software-Entwicklung, Heidelberg, Berlin, Oxford: Spektrum Akademischer Verlag, 1996
Baracs J, Geometrie Spatiale, Faculte de l'amenagement, Universite de Montreal
Bechara A, Damasiio H, Tranel D, Damasio A, “Deciding advantageously before knowing the advantageous strategy”, Science 275, 1997, pp 1293–1295
Block JR, Yuker H, Can You Believe Your Eyes?, New York: Gardner Press, 1989
Brisson DW (ed), Hypergraphics – Visualizing Complex Relationships in Art, Science and Technology, Boulder: Westview Press, 1978 pp 177–185
Broudy HS, The Role of Imagery in Learning, Occasional Paper 1, Getty Center for Education in the Arts, 1991
Card S, Mackinlay J, Schneiderman B, Readings in Information Visualization: Using Vision to Think, Morgan Kaufmann, 1999
Caruana W, Aboriginal Art, New York: Thames & Hudson 1998
Cocran CF, [Letter to Scientific American], Scientific American, vol 214, 1966, p 8
Cole KC, Vision: In the Eye of the Beholder, San Francisco: Exploritorium, 1978
Cowan T, Pringle R, “An Investigation of the Cues Responsible for Figure Impossibility” Journal of Experimental Psychology; Human Perception and Performance, vol 4, no 1, 1978, pp 112–120
Cowen T, “Organizing the Properties of Impossible Figures”, Perception, vol 6, no 1, 1977, pp 41–56
Cowan T, “The Theory of Braids and the Analysis of Impossible Figures”, Journal of Mathematical Psychology, vol 11, 3, 1974, pp 190–212
Cowen T, “Supp lementary Report: Braids, Side Segments, and Impossible Figures”, Journal of Mathematical Psychology, vol 16, 1977, pp 254–260
Coxeter HSM et al (eds), M. C. Escher: Art and Science, Amsterdam, Elsevier, 1986
Cultural Project Department I, The Asahi Shimbun, Toyko, The Expanding Perceptual World – A Museum of Fun I [in Japanese and English], Japan: Topp an Printing Co, 1979
Cultural Project Department I, The Asahi Shimbun, Toyko, The Expanding Perceptual World – A Museum of Fun II [in Japanese and English], Japan: Topp an Printing Co, 1984
Cunningham S, “Computer Graphics: Programming, Problem Solving and Visual Communication” [draft], http://www.cs.csustan.edu/~rsc/NSF/Notes.pdf
Damasio A, Decarte’s error, New York: Putnam Publishing Co, 1994
Del-Prete S, Illusoria, Bern: Benteli, 1987
Del-Prete S, Illusorismen, Illusorismes, Illusorisms, Bern: Benteli, 1984
De Mey J, Exhibition Catalogue, Belgium, 1994
Draper S, “The Penrose Triangle and a Family of Related Figures”, Perception, vol 7, 1978, pp 283–296
Draper SW, “The Use of Gradient and Dual Space in Line Drawing Interpretation”, Artificial Intelligence, vol 17, no 1, 1981, pp 461–508
Dreyfus T, Imagery and Reasoning in Mathematics and Mathematics Education; Selected Lectures from the 7th ICMES, Les Presses Laval, 1994, pp 107–122
Eco U, The Open Work, Cambridge: Harvard University Press, 1979
Edwards B, Drawing on the Right Side of the Brain, (2nd Edition), Tarcher, 1997
Ernst B, Adventures with Impossible Figures, Norfolk: Tarquin Publications, 1986
Ernst B, The Eye Bequiled: Optical Illusions, Germany: Benedikt Taschen, 1992
Ernst B, The Magic Mirror of M. C. Escher, Norfolk: Tarquin Publications, 1985
Ernst B, Nieuwe Advonturen met On-mogelijke Figuren, Den Haag: Koninklijke-Bibliotheek, 1990
Escher MC, Escher on Escher: Exploring the Infinite, New York: Harry Abrams Inc, 1989
Falk G, “Interpretation of Imperfect Line-data as a 3-D Scene” Artificial Intelligence, vol 3, no 2, 1972, pp 101–144
Falletta N, The Paradoxicon, New York, John Wiley & Sons, 1983
Farkas T, The Paintings of Tamas Farkas, exhibition catalogue, Budapest, 1989
Fineman M, The Inquisitive Eye, Oxford: Oxford University, 1981
Frisby J, Seeing: Illusion, Brain and Mind, Oxford: Oxford University Press, 1980
Fukuda S, Visual Illusion [in Japanese and English], Japan: Rikuyosha Publishing, 1982
Gardner H, Multiple intelligences: The theory in practice, New York: Harper Collins, 1993
Gardner H, Intelligence Reframed, Multiple Intelligences for the
21st Century, New York: Harper Collins, 2000
Gardner M, “Of Optical Illusions from Figures that are Undecidable to Hot Dogs that Float”, Scientific American, 1968, pp 48–58
Gibilisco S, Optical Illusions: Puzzles, Paradoxes and Brain Teasers #4, PA: Tab Books, 1990
Goleman D, Emotional intelligence, New York: Bantam, 1995
Gombrich EH, The Sense of Order: A Study in the Psychology of Decorative Art, Cornell University Press, New York, 1984
Gooding DC, “Dimensions of Creativity: Visualization, Inference and Explanation in the Sciences” http://www.bath.ac.uk/~hssdcg/Research/Dimensions_1.html
Gooding DC, “Picturing Scientific Practice: The roles of images in scientific discovery and the dissemination of new science”, Gil F (ed), Scientific Cultures, Lisbon, 1999
Gooding DC, Cantor G, James F, Faraday, New York: Humanities Press, 1996
Grandin T, Thinking in Pictures: my life as an autistic, New York: Vintage Books, 1996
Gregory R, Eye and Brain: The Psychology of Seeing, Princeton University Press, 1998
Gregory R, Harris J, et al, The Artful Eye, Oxford: Oxford University Press, 1995
Gulbins J, Kahrmann C, Mut zur Typographie: Ein Kurs für DTP und Textverarbeitung korrigierter Nachdruck, Berlin, Heidelberg: Springer Verlag, 1993
Gregory R, The Intelligent Eye, London, Weidenfeld and Nicholson, 1970
Gregory R, “Visual Illusions” Scientific American, November 1968, pp 48–58
Hadamard J, The psychology of invention in the mathematical field, Princeton University Press, 1945
Harris WF, “Perceptual Singularities in Impossible Pictures Represent Screw Dislocations” South African Journal of Science, vol 69, 1973, pp 10–13
Hanisch F, Strasser W, Interactive Web-based Courseware for Visualization
“Spielend Visualisieren” http://www.gris.uni-tuebingen.de/projecs/vis
WSI/GRIS University of Tübingen, 2000
Hanks K, Belliston L, Rapid Viz – A new Method for the Rapid Visualization of Ideas, Willaim Kaufmann Inc, 1980
Hayward R, “Blivits: Research and Development” Worm Runners’ Digest, vol 10, 1968, pp 89–92
“The Hidden Mind”, Scientific American (special issue), 2002
Hoffman D, Visual intelligence: how we create what we see, New York: WW Norton & Co, 1997
Hofstadter D, Godel, Escher, Bach: An Eternal Golden Braid, New York: Vintage Books, 1980
Holzinger A, Basiswissen Multimedia Band 1: Technik 1 Auflage, Würzburg: Vogel Buchverlag, 2000
Holzinger A, Basiswissen Multimedia Band 2: Lernen 1 Auflage, Würzburg: Vogel Buchverlag, 2000
Holzinger A, Basiswissen Multimedia Band 3: Design 1 Auflage, Würzburg: Vogel Buchverlag, 2001
Horn R, Visual Language; Global Communication for the 21st Century,
Macro Vu Press, 1998
Huff D, How to Lie with Statistics, Norton WW & Company, 1993
Huffman DA, “Impossible Objects as Nonsense Sentences” in Melzer and Michie (ed), Machine Intelligence 6, Edinburgh University Press, 1971, pp 295–323
Hughes P, George B, Vicious Circles and Infinity: A Panoply of Paradoxes, London: Jonathan Cape, 1975
Hyzer WG, “Plenty of Chances to goAstry in Photographic Interpretation” Photo Methods for Industry, January 1970, pp 20–24
Issing LJ, Klimsa P, (Hrsg), Information und Lernen mit Multimedia, 2, überarbeitete Auflage, Weinheim: Psychologie Verlags Union, 1997
Istvan O, OYTIS, exhibition catalogue, Budapest: Balassi Kiado, 1994
Jarz EM, Entwicklung multimedialer Systeme: Planung von Lern- und Masseninformationssystemen, Wiesbaden: Deutscher UniversitätsVerlag, 1996
Johnson R, Inner work, San Francisco: Harper & Row, 1986
Jung C, Man and his symbols, New York: Doubleday & Co, 1964
Kanade T, “Recovery of the Three-dimensional Shape of an Object from a Single View” Artifical Intelligence, vol 17, no 1, 1981, pp 409–460
Kanade T, “A Theory of the Orgami World” Artificial Intelligence, vol 13, 1980, pp 279–311
Kemp M, Visualizations: The Nature book of Art and Science, Oxford Press, 2000
Klein R, Hanisch F, Strasser W, Interactive Web-based Courseware for Computer Graphics “Computergraphik Spielend Lernen” http://www.gris.uni-tuebingen.de/projects/grdev WSI/GRIS University of Tübingen, 1997
Kosslyn S, Image and Brain, MIT Press, 1996
Kulpa Z, “Are Impossible Figures Possible?” Signal Processing, vol 5, no 3, 1983, pp 201–220
Kulpa Z, Challenge to Geometry – Oscar Reutersvard, Zenon Kulpa – Impossible Figures, Lodz: Art Museum of Lodz, exhibition catalogue, 1984
Kulpa Z, Oscar Reutersvard [in Russian and English], Moscow: Contemporary Art Center, Architectural Gallery, exhibition catalogue, 1993
Kulpa Z, “Oscar Reutersvard’s Exploration of Impossible Lands” in 150 Omojliga figurer – Oscar Reutersvard, Malmo: Malmo Museum, exhibition catalogue, 1981
Kulpa Z, “Putting Order in the Impossible” in E. Terouanne (ed), Proceedings of the 16th Meeting of the European Mathematical Psychology Group: Montpellier, 1985, pp 127–144
Kulpa Z, Figury Niemozliwe Lekcja Widzenia Przestrzeni [in Polish], exhibition catalogue, Warsaw, Galeria PSEP, 1986
LeDoux J, “Sensory systems and emotion”, Integrative Psychiatry 4, 1986, pp 237–243
LeDoux J, The emotional brain, New York: Simon & Schuster, 1996
Locher JL (ed), M. C. Escher: His Life and Complete Graphic Work, New York: Harry N. Adams, 1982
Mad Magazine, [Letters to the editor] vol 95, 1965
McKim RH, Thinking Visually: A Strategy Manual for Problem
Solving, Dale Seymour
Nelson R, Proofs without words, Math Association of America, 1994
Nicolaides K, The natural way to draw, Boston: Houghton Mifflin Co, 1941
Norman D, Things that make us smart, Reading Mass, Perseus Books, 1993
Norman D, The design of everyday things, Basic Books, New York, 1988
Ogden C, Richards I, The Meaning of Meaning, Harcourt Brace Jovanovich, 1979
O’Leary C, “Content is Queen: the emerging women’s voice in new and interactive media!” [Thesis]
O’Leary C, “Web Design as a New Art Form: Escher’s influence on the conceptual development of multi-dimensional artworks” [Unpublished]
Ong WJ, Orality and Literacy: The Technologizing of the World, Routledge, 1993
Ornstein R, The right mind: Making sense of the hemispheres, New York: Harcourt, Brace & Co, 1997
Paulsen H, Unmogliche Figuren, Germany
Penrose L, Penrose R, “Impossible objects: A Special Type of Visual Illusion” British Journal of Psychology, vol 49, 1958, pp 31–33
Petry S, Meyer G (ed), The Perception of Illusory Contours, New York: Springer–Verlag, 1987
Rabiger M, Directing: Film techniques and aesthetics (2nd edition), Focal Press, 1997
Rainey PA, Illusions: A Journey into Perception, Connecticut, Shoe String Press, 1973
Reutersvard O, Onmogelijke Figuren, Amsterdam: Meulenhoff, 1983
Reutersvard O, Impossible Figures [In Russian], Moscow, 1990
Reutersvard O, Onmogelijke Figuren in Kleur, Amsterdam: Meulenhoff
Reutersvard O, Omojliga Figurer i Farg, Bodafors: Bokforlaget Doxa AB, 1982
Richard G, Gombrich EH (ed), Illusion in Nature and Art, London: Duckworth, 1973, pp 49–95
Robinson JO, Wilson JA, “The Impossible Colonnade and other Variations of a Well-known Figure” British Journal of Psychology, vol 64, no 3, 1973, pp 363–365
Robinson JO, The Psychology of Visual Illusions, London: Hutchinson University Library, 1972
Schuster DH, “A New Ambiguous Figure: a Three-stick Clevis” American Journal of Psychology, vol 77, 1964, p673
Senechal M, “Parallel worlds: Escher and mathematics, revisited” The Mathematical Intelligencer, 1999, vol 21, p 13
Shapira R, Freeman H, “A Cyclic-order Property of Bodies with Three-face Vertices” IEEE Transactions on Computers, vol C26, no 10, 1977, pp 1035–1039
Shepard R, Mind Sights: Original Visual Illusions, Ambiguities, and other Anomalies, New York: W. H. Freeman and Company, 1990
Singmaster D, “Don’t Believe Your Eyes!” Focus, December 1994, pp 18–21
Sugihara K, “Classification of Impossible Objects” Perception, vol 11, 1982, pp 65–74
Sugihara K, “Dictionary-guided Scene Analysis based on Depth Information” Report on Pattern Information Processing Systems, no 13, Tokyo: Electrotechnical Laboratory, 1977
Sugihara K, “Picture Language for Skeletal polyhedra” Computer Graphics and Image Processing, vol 8, 1978, pp 382–405
Sugihara K, “Studies on Mathematical Structures of Line Drawings of Polyhedra and their Applications to Scene Analysis” Tokyo: Researches of the Electrotechnical Laboratory, no 800, 1979
Teuber M, “Sources of Ambiguity in the Prints of Mauritis C Escher” Scientific American, July, 1974, pp 90–104
Terouanne E, “Impossible Figures and Interpretations of Polyhedral Figures” Journal of Mathematical Psychology, vol 27, 1983, pp 370–405
Terouanne E, “On a Class of ‘Impossible’ Figures: a New Language for a New analysis” Journal of Mathematical Psychology, vol 22, no 1, 1983, pp 24–47
Thro EB, “Distinguishing Two classes of Impossible Objects” Perception, vol 12, no 6, 1983, pp 733–751
Tobias S, They are not dumb they are different, Science News Books, 1994
Turner H, Triad: Optical Illusions and How to Design Them, New York: Dover Publications, 1978
Tufte E, The Visual Display of Quantitative Information, Graphics Press, 2000
Tufte E, Envisioning Information, Graphics Press, 1990
Tufte E, Visual Explanations, Graphics Press, 1997
Vihma S (ed), Objects and Images. Studies in Design and Advertising, Helsinki: University of Industrial Arts Publ, 1992
Vygotsky L, Thought and Language, MIT Press
Wainer H, Visual revelations: tales of triumph and deception, Copernicus (Springer-Verlag), 1997
West T, In the Mind’s Eye, Prometheus Books, 1998
Whiteley W, “Realizability of Polyhedra” Structural Topology, vol 1, Montreal: University of Montreal Press, 1979, pp 46–58
Whiteley W, “Teaching to see like a mathematician” [preprint], http://www.math.yorku.ca/Who/Faculty/Whiteley/menu.html
Wildbur P, Burke M, Information Graphics: Innovative solutions in contemporary design, Thames Hudson, 1998
Williams R, “Beyond visual literacy: omnipahsism, a theory of cognitive balance, part I”, Journal of Visual Literacy, Nelson Knupfer N (ed), vol 19, no 2, 1999, pp 159–178
Williams R, “Visual illiteracy and intuitive visual persuasion, part II”, Journal of Visual Literacy, Nelson Knupfer N (ed), vol 20, no 1, 2000, pp 159–178
Williams R, “Omniphasic visual-media literacy in the classroom, part III”, Journal of Visual Literacy, Nelson Knupfer N (ed), vol 20, no 2, 2000
Winchester S, The Map That Changed The World, Harper Collins, 2001
Winston PH (ed), The Psychology of Computer Vision, New York: McGraw-Hill, 1975, pp 19–91
Wolfe J, “Hidden visual processes”, Scientific American, vol 248, no 2, 1983
Yakimanskya IS, The development of spatial thinking in schoolchildren, Soviet Studies in Mathematics Education, National Council of Teachers of Mathematics, 1991
Young AW, Deregowski JB, “Learning to See the Impossible” Perception, vol 10, 1981, pp 91–105
Zee A, Fearful Symmetry, the search for beauty in modern physics, Princeton University Press, 1996
Bibliography with Annotated Notes
Balzert H, Lehrbuch der Software-Technik: Software-Entwicklung Heidelberg, Berlin, Oxford: Spektrum Akademischer Verlag, 1996
Dieses ausgezeichnete Lehrbuch ist für Informatiker geschrieben. Die Kapitel über Ergonomie und die Gestaltung von Benutzerschnittstellen sind aber auch für Laien verständlich.
Baracs J, Geometrie Spatiale, Faculte de l'amenagement, Universite de Montreal
CD and booklet of spatial geometry exercises
Edwards B, Drawing on the Right Side of the Brain J. P. Tarcher Inc, Distributed by Houghton Mifflin Co, 1979
This is the classic book for teaching drawing skills. Edwards explains the different thinking styles used by the left and right hemispheres of the brain and includes exercises to strengthen right brain thinking. Although intended to teach drawing skills to artists, this book was my introduction to the idea that different modes of thinking are used for different tasks.
Gulbins J, Kahrmann C, Mut zur Typographie: Ein Kurs für DTP und Textverarbeitung korrigierter Nachdruck, Berlin, Heidelberg: Springer Verlag, 1993
Hierbei handelt es sich um eine sehr verständliche Einführung in die Grundlagen der Typografie einschließlich Schriftarten, Text und Seitengestaltung. Die theoretischen Erläuterungen sind mit vielen praktischen Beispielen untersetzt.
Hanks K, Belliston L, Rapid Viz – A new Method for the Rapid Visualization of Ideas, Willaim Kaufmann Inc, 1980
The authors propose the idea that using images, in the form of sketches and doodles, can speed up thinking and improve creativity. The book has many exercises to teach drawing concepts to the non-artist, and exercises to help the reader start thinking in new directions.
Holzinger A, Basiswissen Multimedia Band 1: Technik 1 Auflage, Würzburg: Vogel Buchverlag, 2000
Holzinger A, Basiswissen Multimedia Band 2: Lernen 1 Auflage, Würzburg: Vogel Buchverlag, 2000
Holzinger A, Basiswissen Multimedia Band 3: Design 1 Auflage, Würzburg: Vogel Buchverlag, 2001
Diese drei Bände sind aus Vorlesungsscripten des Autors entstanden. Sie sind fachlich fundiert und mit vielen Beispielen, Links und Verweisen angereichert. Allerdings sind die Ausführungen für den Laien manchmal etwas knapp formuliert.
Jarz EM, Entwicklung multimedialer Systeme: Planung von Lern- und Masseninformationssystemen, Wiesbaden: Deutscher UniversitätsVerlag, 1996
Dieses Buch entstand auf Basis einer Dissertation und enthält eine sehr ausführliche Charakterisierung einzelner Medien inklusive detaillierter Erläuterung der technischen und gestalterischen Parameter
Issing LJ, Klimsa P, (Hrsg), Information und Lernen mit Multimedia, 2, überarbeitete Auflage, Weinheim: Psychologie Verlags Union, 1997
Bei diesem Buch handelt es sich um eine Sammlung von Beiträgen zum Lernen mit Multimedia. Die Bandbreite reicht von technischen Aspekten über Lerntheorien, Hypertext und Hypermedia, Lernen in multimedialen Umgebungen bis zu Werkzeugen für und Evaluierung von Multimedia.
Kemp M, Visualizations: The Nature book of Art and Science, Oxford Press, 2000
A collection of Martin Kemp's brilliant articles from the Nature journal on the influence of art and science on each other, and their shared "structural intuitions"
OECD Programme For International Student Assessment (PISA), http://www.pisa.oecd.org/
An important survey of student knowledge and skills that could help find evidence for the need for different thinking and learning modes. “Abstract: Are students well prepared to meet the challenges of the future? Are they able to analyse, reason and communicate their ideas effectively? Do they have the capacity to continue learning throughout life? These are questions that parents, students, the public and those who run education systems continually ask.”PISA, a new three-yearly survey of the knowledge and skills of 15-year-olds in the principal industrialised countries, provides some answers. It assesses how far students near the end of compulsory education have acquired some of the knowledge and skills that are essential for full participation in society. It presents evidence on student performance in reading, mathematical and scientific literacy, reveals factors that influence the development of these skills at home and at school, and examines what the implications are for policy development.
O’Leary C, “Content is Queen: the emerging women’s voice in new and interactive media!” Thesis. While “content may be King” the King is not the only voice-that is, the dominant culture/media/interpreter of “story.” Whatever content we develop, immersive worlds have a unique opp ortunity to offer multi-vocalities, not only in the text of the story but in the symbols of class and culture-in the signifiers of the users. The “women’s gaze” is particularly pertinent if we are trying to attract girls and women into science and engineering. Identifying ways to connect with young women’s understanding of the context of learning these subjects in their lives.
O’Leary C, “Web Design as a New Art Form: Escher’s influence on the conceptual development of multi-dimensional artworks” [Unpublished] The author discusses M.C. Escher’s art as a symbolic ‘gift’ to society. The influence of an artist such as Escher paved the way for minds to explore new dimensions through the representation of visual illusion and fantasies of perception. He inspired artists as well as leading mathematicians and scientists to explore new dimensions within their respective fields: from geometry to spatial relationships, to works of art using pencil, charcoal, a paintbrush, photography, film, video and in more recent years within cyberspace and the interactive environment. She proposes that the web page has become a new art form, exploring theoretical and actual relationships between Escher’s work and new artists and relate it to the paradigm shift in realities that Escher’s work inspires.
Rabiger M, Directing: Film techniques and aesthetics (2nd edition) Focal Press, 1997
The best book I have encountered on the process of linear storytelling through film.
Senechal M, “Parallel worlds: Escher and mathematics, revisited” The Mathematical Intelligencer, vol 21, p13, 1999,
Discusses reasons for the popularity of Dutch artist MC Escher
Tufte E, The Visual Display of Quantitative Information Graphics Press, 2000
Tufte E, Envisioning Information Graphics Press, 1990
Tufte E, Visual Explanations Graphics Press, 1997
Tufte’s books are a good resource on the use of graphic elements to improve communication. The books are filled with examples, modern and historical, of effective (and not so effective) applications of visual communication. Includes discussions of how line, shape, color, and space can be used to improve understanding of printed information.
Wildbur P, Burke M, Information Graphics: Innovative solutions in contemporary design, Thames Hudson, 1998
A broad spectrum of great pieces of information design (including interactive work). Discussion and analysis of the organization and presentation of information.
http://www.vrefresh.com/Users.htm A web site demonstrating visualization and virtual reality
Web-based Publication Bibliography
Cunningham S, “Computer Graphics: Programming, Problem Solving and Visual Communication” [draft] http://www.cs.csustan.edu/~rsc/NSF/Notes.pdf
Gooding DC, “Dimensions of Creativity: Visualization, Inference and Explanation in the Sciences” http://www.bath.ac.uk/~hssdcg/Research/Dimensions_1.html
Hanisch F, Strasser W, Interactive Web-based Courseware for Visualization
“Spielend Visualisieren” WSI/GRIS University of Tübingen, 2000
http://www.gris.uni-tuebingen.de/projecs/vis
Klein R, Hanisch F, Strasser W, Interactive Web-based Courseware for Computer Graphics “Computergraphik Spielend Lernen” WSI/GRIS University of Tübingen, 1997 http://www.gris.uni-tuebingen.de/projects/grdev
OECD Programme For International Student Assessment (PISA), http://www.pisa.oecd.org/
An important survey of student knowledge and skills that could help find evidence for the need for different thinking and learning modes. “Abstract: Are students well prepared to meet the challenges of the future? Are they able to analyse, reason and communicate their ideas effectively? Do they have the capacity to continue learning throughout life? These are questions that parents, students, the public and those who run education systems continually ask.”PISA, a new three-yearly survey of the knowledge and skills of 15-year-olds in the principal industrialised countries, provides some answers. It assesses how far students near the end of compulsory education have acquired some of the knowledge and skills that are essential for full participation in society. It presents evidence on student performance in reading, mathematical and scientific literacy, reveals factors that influence the development of these skills at home and at school, and examines what the implications are for policy development.
http://www.socsci.uci.edu/cogsci/personnel/hoffman/vi.html
Tuebingen applets: www.gris.uni-tuebingen.de/projects/grdev [See also projects/vis]
Whiteley W, “Teaching to see like a mathematician” [preprint], http://www.math.yorku.ca/Who/Faculty/Whiteley/menu.html
http://www.vrefresh.com/Users.htm A web site demonstrating visualization and virtual reality
ACM SIGGRAPH is the ACM Special Interest Group for Computer Graphics and Interactive Techniques. ACM is the Association for Computing Machinery. |
Powered by Drupal